India’s Crude Imports Fell 11% — The Demand Drop Matters More Than the Tankers
Crude imports fell to 19.01 million tonnes and fuel consumption hit its lowest since September 2024, while LPG imports jumped—an uneven energy picture rather than a simple demand collapse.
India’s Crude Imports Fell 11% — The Demand Drop Matters More Than the Tankers
*By PriceVia Macro Desk | Published September 18, 2026 | Updated September 18, 2026*
Why this matters now
Crude imports fell to 19.01 million tonnes and fuel consumption hit its lowest since September 2024, while LPG imports jumped—an uneven energy picture rather than a simple demand collapse.
Key points
- August crude imports fell more than 11% month on month to 19.01 million metric tonnes. - Fuel consumption declined 6.3% to 18.61 million tonnes, the lowest level since September 2024. - LPG imports rose to 1.30 million tonnes from 870,000, showing sharp divergence inside the energy basket.
The numbers
| Metric | Value | Context | |---|---:|---| | Crude imports | 19.01m tonnes | August | | Monthly change | More than -11% | Crude imports | | Annual change | -3% | From 19.60m tonnes | | Fuel consumption | 18.61m tonnes | Down 6.3% monthly | | LPG imports | 1.30m tonnes | From 0.87m | | Product exports | 4.92m tonnes | Down over 13% annually |
What happened — confirmed facts
PPAC data showed lower crude imports both month on month and year on year. Petroleum-product imports rose more than 9% from July but remained roughly 40% below a year earlier, while product exports weakened. [S1, S2] Jet-fuel exports fell more than 28% annually, petrol exports 15% and diesel exports nearly 19%. Reuters noted that preliminary figures can change because private refiners provide data at their discretion. [S1, S3]
What everyone is watching
Refinery maintenance, inventory decisions and domestic consumption must be separated. Lower imports can signal weaker demand, planned shutdowns or stock drawdowns; the next month determines which explanation dominates. The LPG increase matters for household and industrial supply, while weaker transport-fuel exports affect refinery utilisation and margins differently across companies.
What the market may be missing — PriceVia analysis
PriceVia analysis: the most important number is the 6.3% consumption decline, not merely fewer tankers. It indicates less product leaving the domestic system and needs confirmation from mobility, industry and seasonal data. Falling imports do not automatically improve the trade balance if oil prices rise sharply. India can buy fewer barrels yet pay a stubbornly high bill when the benchmark and rupee move against it.
Positive case
Consumption recovers after temporary maintenance and weather effects while crude prices ease. Refiners optimise inventories without losing structural demand.
Downside case
Weak consumption persists, exports fall and high crude compresses refinery margins. Lower volumes then reflect demand stress rather than efficiency.
What would change the story
September imports, refinery runs, product consumption and inventory data will show whether August was operational timing or a broader slowdown.
Related stocks and themes
Reliance Industries, IOC, BPCL, HPCL, Nayara, LPG distributors, transport fuels, the rupee and India’s trade balance.
How to read it
Review refinery utilisation and product-level demand before interpreting lower crude imports as either bullish cost relief or bearish economic weakness.
Reader checklist
- Confirm september consumption in a primary disclosure before changing the thesis. - Compare refinery utilisation with the headline narrative; they may move in different directions. - Reassess after new information on product exports rather than treating the first report as a completed outcome.
PriceVia View
Imports fell sharply, but the system sent mixed signals. Consumption, LPG and exports moved in different directions, so one headline cannot describe the energy economy.
Sources and timestamps
- [S1 — Reuters: India crude imports fall](https://www.reuters.com/business/indias-august-crude-oil-imports-fall-over-11-month-on-month-2026-09-18/) — published 2026-09-18 10:02 UTC; accessed 2026-09-18T13:15:00+05:30 - [S2 — Petroleum Planning and Analysis Cell](https://ppac.gov.in/) — published 2026-09-18; accessed 2026-09-18T13:15:00+05:30 - [S3 — Ministry of Petroleum and Natural Gas](https://mopng.gov.in/) — published 2026-09-18; accessed 2026-09-18T13:15:00+05:30 - [S4 — Commerce Ministry trade statistics](https://commerce.gov.in/trade-statistics/) — published 2026-09-18; accessed 2026-09-18T13:15:00+05:30
Visual disclosure
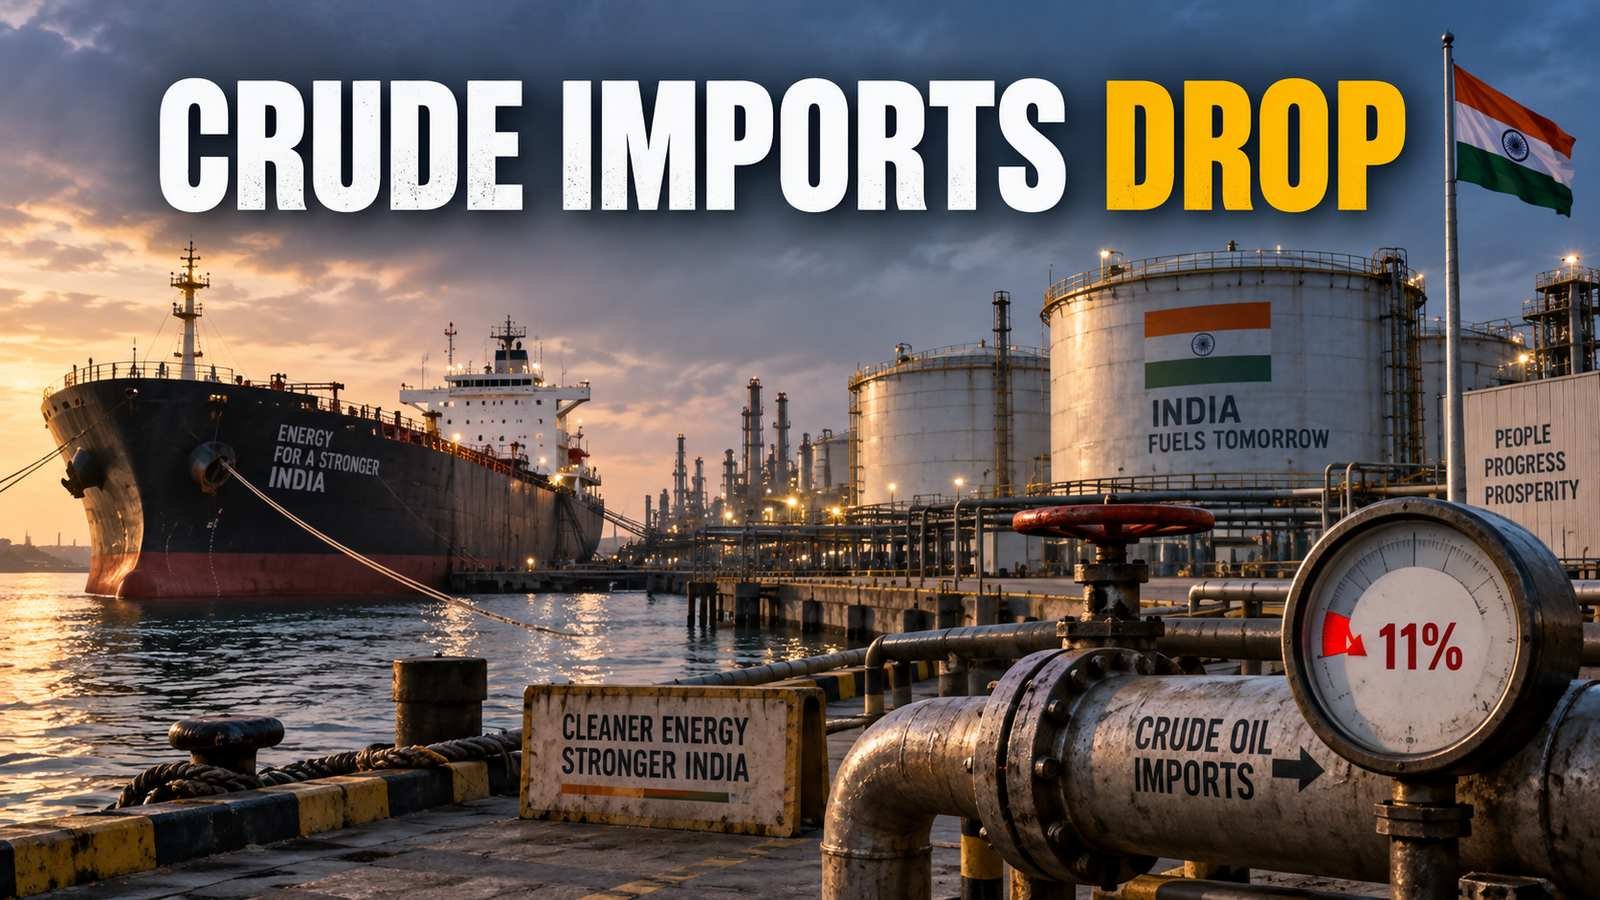
Hero visual created specifically for this article. Thumbnail text: “CRUDE IMPORTS DROP”. It is an editorial illustration, not a market-data, legal or regulatory screenshot.
Market-risk disclaimer
This article is for market education and information only. It is not investment advice, a recommendation or a promise of returns. Market prices, policy decisions, deal terms and forecasts can change. Verify the latest primary disclosures and assess suitability and risk independently.
- September consumption
- Refinery utilisation
- Product exports
Risk context: This article is for market education and information only. It is not investment advice, a recommendation or a promise of returns. Market prices, policy decisions, deal terms and forecasts can change. Verify the latest primary disclosures and assess suitability and risk independently.
- reuters.com2026-09-18 10:02 UTC
- ppac.gov.in2026-09-18
- mopng.gov.in2026-09-18
- commerce.gov.in2026-09-18
Related PriceVia analysis
Delhi Metro Carried a Record 82.45 Lakh Riders in One Day — A Bus Strike Revealed Its Spare Capacity
A sudden DTC bus disruption pushed Delhi Metro to a new daily record, testing whether the network can absorb shocks without letting reliability deteriorate.

Tessolve Wants $500 Million of Revenue in Four Years — Two Acquisitions Could Decide the Semiconductor Services Race
The Hero Electronix-owned chip engineering specialist is evaluating two purchases as it tries to scale from design and testing into a larger global semiconductor-services platform.
India Gave Compressed Biogas an Assured Buyer — Price Support Could Finally Turn Waste Into Bankable Fuel
New GOBARdhan rules address the two questions that have stalled many waste-to-gas projects: who will buy the output and how predictable will the price be.

India's New ESG Assurance Standard Starts in April 2027 — Two Big Carve-Outs Will Shape What Investors Can Trust
SSA 5000 broadens assurance across climate, labour and biodiversity disclosures, but excludes joint audits and forward-looking statements from the international framework.