Indian Stocks Logged Six Losing Weeks — Friday’s Bounce Did Not End the Slide
The Nifty rose on Friday but finished a sixth straight week lower as oil above $100, higher global yields and a crowded IPO calendar pulled against bargain buying.
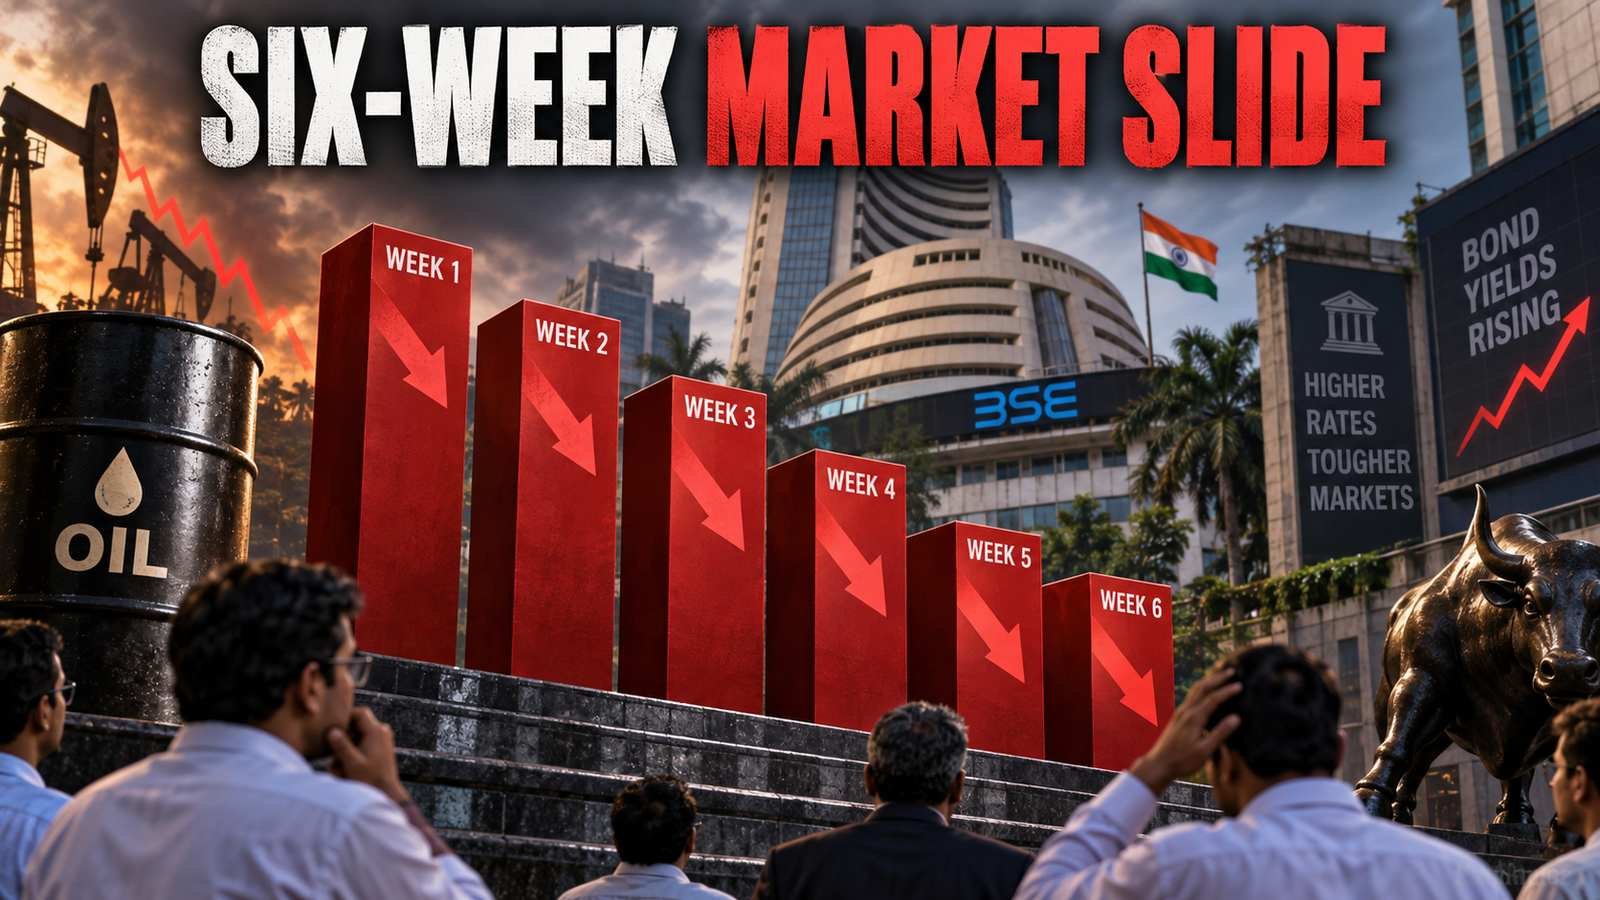
Indian Stocks Logged Six Losing Weeks — Friday’s Bounce Did Not End the Slide
*By PriceVia Markets Desk | Published September 18, 2026 | Updated September 18, 2026*
Why this matters now
The Nifty rose on Friday but finished a sixth straight week lower as oil above $100, higher global yields and a crowded IPO calendar pulled against bargain buying.
Key points
- Indian equities completed their longest weekly losing streak in six years. - The Nifty gained 0.33% on Friday but lost 0.22% for the week; the Sensex fell 0.65% weekly. - Ten of 16 major sectors declined, suggesting pressure beyond one company or industry.
The numbers
| Metric | Value | Context | |---|---:|---| | Weekly losing streak | 6 weeks | Longest since 2020 | | Nifty Friday | 23,346.40 | Up 0.33% | | Sensex Friday | 74,294.96 | Down 0.03% | | Nifty weekly | -0.22% | Sixth loss | | Sensex weekly | -0.65% | Weekly change | | Weak sectors | 10 of 16 | Broad pressure |
What happened — confirmed facts
Friday’s bargain buying lifted the Nifty, but the Sensex ended nearly flat and both benchmarks closed lower for the week. Crude above $100 and tighter monetary policy reduced the appeal of Indian risk assets while IPO demand absorbed secondary-market liquidity. [S1, S2] Small caps slipped 0.15% and mid caps 0.01% for the week. Insurers bucked the trend as investors welcomed stronger growth expectations and more detailed profitability reporting under a new accounting framework. [S1, S3]
What everyone is watching
Foreign-flow data, oil and long-term bond yields are the main confirmation signals. A one-day rise after oversold conditions is less persuasive than improving breadth and a return of sustained institutional buying. The IPO calendar is a temporary but important liquidity competitor. Money moving into new issues does not leave the market permanently, yet it can weaken demand for existing stocks during an already fragile period.
What the market may be missing — PriceVia analysis
PriceVia analysis: index losses look mild, but duration changes investor behaviour. Six consecutive down weeks can tighten risk limits and encourage selling into rebounds even without a dramatic single-day crash. Sector breadth matters more than the Friday headline. When ten of sixteen groups fall together, the problem is increasingly macro—discount rates, oil and liquidity—rather than a narrow earnings disappointment.
Positive case
Oil retreats, global yields stabilise and IPO liquidity recycles into listed shares. Market breadth improves and the six-week decline attracts long-horizon domestic money.
Downside case
Oil rebounds, foreign selling persists and new-issue demand drains more liquidity. A shallow index fall then becomes a larger correction in expensive or leveraged pockets.
What would change the story
Two weeks of positive breadth, improving foreign flows and lower crude would provide stronger reversal evidence than a single bargain-buying session.
Related stocks and themes
Nifty 50, Sensex, mid caps, small caps, insurers, oil-sensitive sectors, foreign flows, IPOs and Indian government bonds.
How to read it
Track sector participation and institutional flows alongside the index; avoid treating one green close as proof that a six-week regime has ended.
Reader checklist
- Confirm foreign portfolio flows in a primary disclosure before changing the thesis. - Compare oil above $100 with the headline narrative; they may move in different directions. - Reassess after new information on sector breadth rather than treating the first report as a completed outcome.
PriceVia View
Friday stopped the day’s fall, not the trend. The market needs breadth and liquidity confirmation before a bounce can be called a durable turn.
Sources and timestamps
- [S1 — Reuters: Indian shares post sixth weekly loss](https://www.reuters.com/world/india/indian-shares-set-inch-higher-oil-eases-ipo-rush-cap-upside-2026-09-18/) — published 2026-09-18 03:04 UTC; accessed 2026-09-18T13:15:00+05:30 - [S2 — NSE market data](https://www.nseindia.com/market-data/live-equity-market) — published 2026-09-18; accessed 2026-09-18T13:15:00+05:30 - [S3 — BSE market statistics](https://www.bseindia.com/markets/equity/EQReports/MarketWatch.aspx) — published 2026-09-18; accessed 2026-09-18T13:15:00+05:30 - [S4 — PPAC crude price data](https://ppac.gov.in/prices/international-prices-of-crude-oil) — published 2026-09-18; accessed 2026-09-18T13:15:00+05:30
Visual disclosure
Hero visual created specifically for this article. Thumbnail text: “SIX-WEEK MARKET SLIDE”. It is an editorial illustration, not a market-data, legal or regulatory screenshot.
Market-risk disclaimer
This article is for market education and information only. It is not investment advice, a recommendation or a promise of returns. Market prices, policy decisions, deal terms and forecasts can change. Verify the latest primary disclosures and assess suitability and risk independently.
- Foreign portfolio flows
- Oil above $100
- Sector breadth
Risk context: This article is for market education and information only. It is not investment advice, a recommendation or a promise of returns. Market prices, policy decisions, deal terms and forecasts can change. Verify the latest primary disclosures and assess suitability and risk independently.
- reuters.com2026-09-18 03:04 UTC
- nseindia.com2026-09-18
- bseindia.com2026-09-18
- ppac.gov.in2026-09-18
Related PriceVia analysis
Delhi Metro Carried a Record 82.45 Lakh Riders in One Day — A Bus Strike Revealed Its Spare Capacity
A sudden DTC bus disruption pushed Delhi Metro to a new daily record, testing whether the network can absorb shocks without letting reliability deteriorate.

India Gave Compressed Biogas an Assured Buyer — Price Support Could Finally Turn Waste Into Bankable Fuel
New GOBARdhan rules address the two questions that have stalled many waste-to-gas projects: who will buy the output and how predictable will the price be.

India's New ESG Assurance Standard Starts in April 2027 — Two Big Carve-Outs Will Shape What Investors Can Trust
SSA 5000 broadens assurance across climate, labour and biodiversity disclosures, but excludes joint audits and forward-looking statements from the international framework.
India's Forex Reserves Fell $4.92 Billion — The $780.78 Billion Buffer Is Being Put to Work
The weekly decline arrived as traders reported central-bank dollar selling near a rupee record low, illustrating that reserves are insurance to be deployed—not a score that must rise every week.